
We travel extensively throughout the world and have learned how important it is to choose our destinations with the climate in mind. Cold and soggy or sunny and warm – learn how to choose your perfect destination.
Use these online tools to find worldwide travel destinations with the best weather for any month of the year. Learn to choose your next travel destination based on real weather data not sales hype. These tools work for every season or month of the year… and for any region or country in the world.
On a recent trip to South-east Asia, for example, we wanted to go snorkeling in January. In our experience, the best snorkeling is during sunny weather when the sunlight brings out all the colors of the coral reef and the beauty of the tropical fish that live there. When we began to research the trip, we found several likely spots with good snorkeling in Bali, Indonesia, Thailand, and Malaysia.
As we researched the weather in these locations, we realized that there are big regional variations in the weather for January in SE Asia. Some places experience their wet season during January and others have dry weather. It took a bit of research, but we managed to find a place in Thailand that met all our criteria: excellent snorkeling without huge crowds, and dry, sunny weather in January. This turned out to be a wonderful trip of a lifetime in the Similan and Surin Islands of Thailand – check it out!

Here are the top six tools we use for finding the best destinations for any time of year.
1. Climatefinder.com
I can highly recommend Climatefinder.com. It is one of the best tools I’ve found for specifying the climate you want and finding places that match. I particularly appreciate the wide range of climate variables that you can tweak, including temperature range and relative humidity. Read my description of Weatherspark below to see why this combination is so critical to your enjoyment of any destination! It can mean the difference between a lovely, comfortable holiday or a miserable experience.
In just two steps, the Climate Finder can help you find the perfect destination based on typical weather conditions. To start, select your month of travel and then select the type of weather you prefer; hot and sunny, warm and pleasant, cool and comfortable, or snowy and sunny.
Hot and sunny, for example, indicates weather that is perfect for sunbathing and beach holidays.
• Maximum day-time temperature between 25 and 35’C (77—95’F)
• The sun shines at least 50% of the time during the day
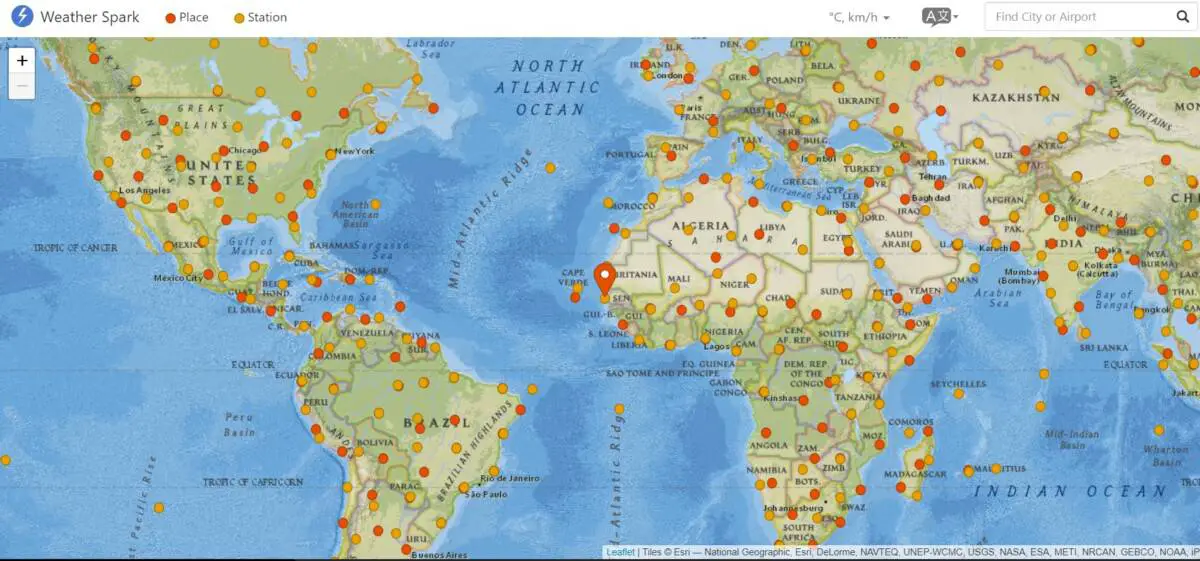
Here is the map showing worldwide results for hot and sunny in February. Nothing could be easier! Two clicks and you have more potential destinations than you could ever imagine. If you want to tweak some variables such as the temperature range or relative humidity, you can go to the very useful advanced search – see below.
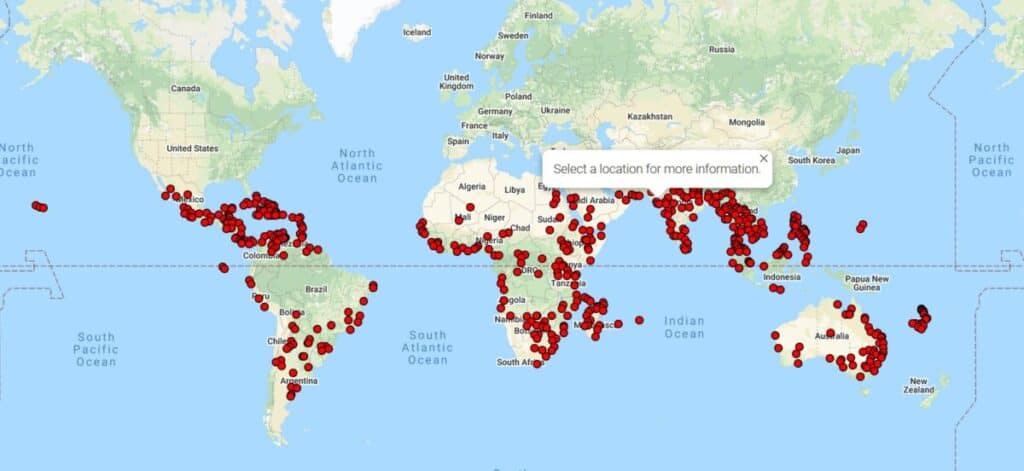
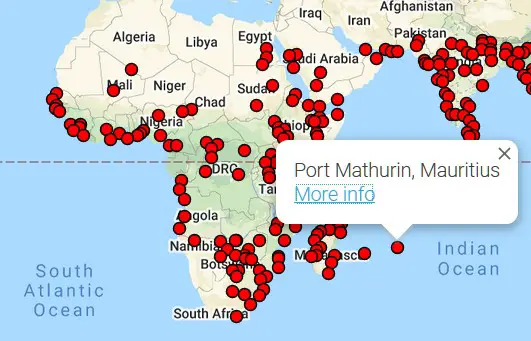
Click on one of the destinations and a small tag will open. Click on “More info” to open a new tab with the Wikipedia article for that location.
Advanced search
ClimateFinder.com also provides an excellent advanced search function with a comprehensive set of variables to choose from. I’m particularly pleased to see that humidity is included. Hot, hot days with high humidity can be extremely uncomfortable and oppressive. If you go strictly by temperature 100’F or 38’C can be OK if it is dry, but it becomes almost unbearable with high humidity.
You can set upper and lower bounds for each of the following climate variables:
- Average daily minimum temperature over the month
- Average daily maximum temperature over the month
- Average daily temperature over the month
- The number of days with precipitation (>0.1mm) over the month
- The number of days with ground frost over the month
- Monthly precipitation
- Average relative humidity over the month
- Average sunshine, as a proportion of daylight hours, over the month
- Average wind speed over the month
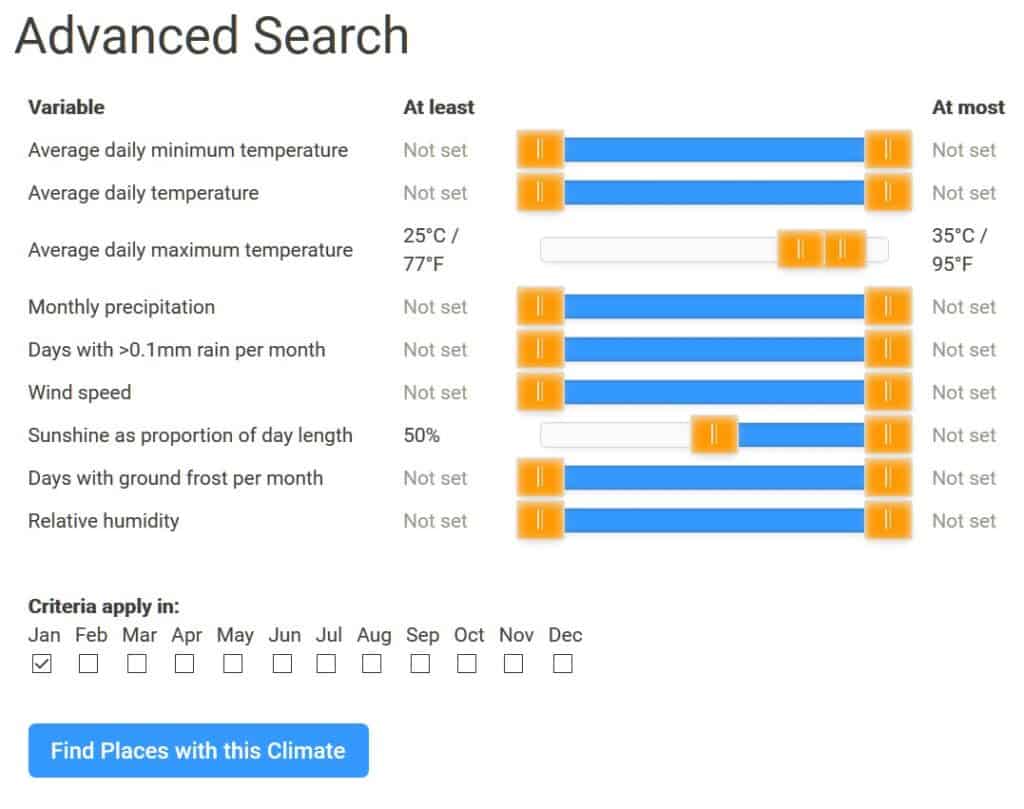
The criteria (upper and lower bounds) can relate to any month or combination of months.
ClimateFinder.com works with both Celsius and Fahrenheit for temperatures, and kilometers per hour or miles per hour for wind speed.
2. Weatherspark.com
When we want to research a specific location, we go to weatherspark.com for detailed information on each place. The great thing about Weatherspark is that you can get an immediate overview of the weather for a full year by looking at the colorful graphic display called Climate Summary. There’s a wealth of information available based on real-world weather records, including the hours of sun to expect, the amount of precipitation, the amount of cloud cover, high and low temperatures, and mugginess. I really appreciate how you can quickly ascertain the relative comfort level at any time of year.
Here’s the Climate Summary for Barcelona, Spain, for example. You can immediately see that June to September would be the best time to visit if you are looking for clear sunny days, with low precipitation and warm temperatures.
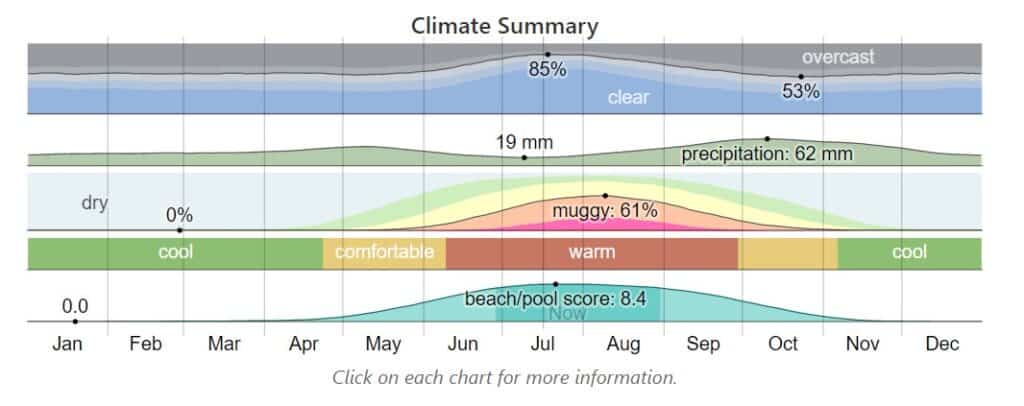
Click on a chart within Weatherspark and you can drill down further for each category, such as percentage of days that are overcast vs clear. One category that I find particularly useful is the percentage of time spent at various humidity comfort levels – sort of an overview of mugginess. I like the terminology used: dry, comfortable, humid, muggy, oppressive, and miserable.
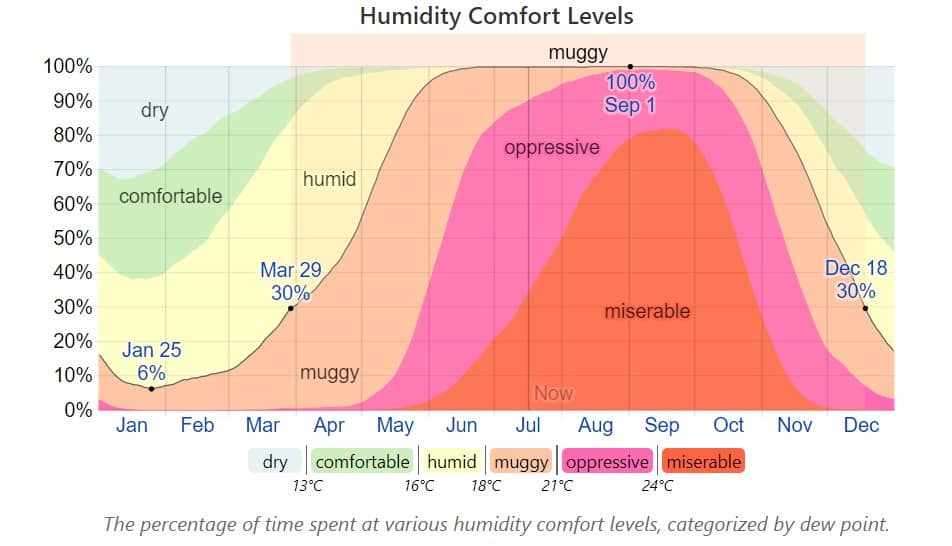
We’re sensitive to high humidity and try to avoid places that are going to be miserable!
The chart below shows humidity levels for Dakar, Senegal. During the months of June to November the weather is usually oppressive or miserable. See how important this information can be when you’re planning a trip? Imagine arriving somewhere in the middle of the miserable months expecting to have a nice holiday on the beach! Ignorance would not be blissful!
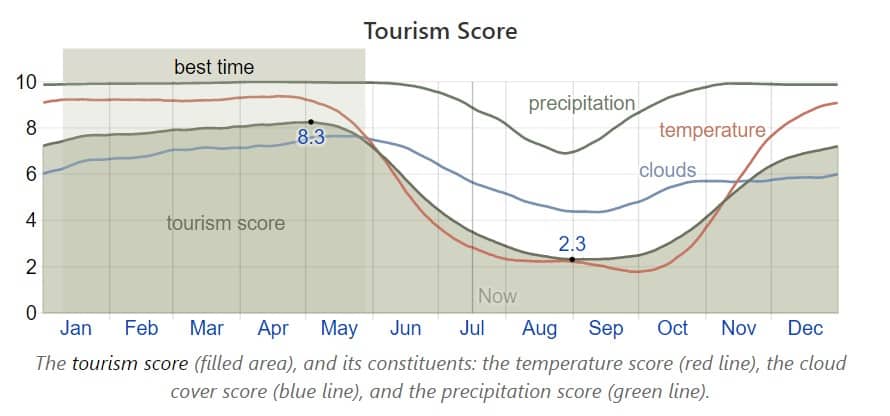
Another great feature of Weatherspark is what they call the Tourism Score. This is their proprietary calculation for the best time to visit a destination based on temperature, cloud cover, and precipitation. We’ve visited Dakar, Senegal a couple of times and the weather was beautiful and far from miserable! It was hot and sunny, without a cloud in the sky. Look at the following chart for the Tourism Score for Dakar and guess when we visited? Both times it was during the period labeled as “best time” to visit – January to May.
Weatherspark calculates a tourism score for each location, wherever possible, to indicate periods of clear, rainless days with temperatures between 18°C and 27°C (65°- 80°F). In the example below you can see a big seasonal variation in Tourism Score, from a high score of 8.3 to a low score of 2.3.
We’ve found Weatherspark to be the best site for detailed research on specific locations. It is user friendly, with lots of handy features that allow you to:
- Switch easily between Celsius and Fahrenheit
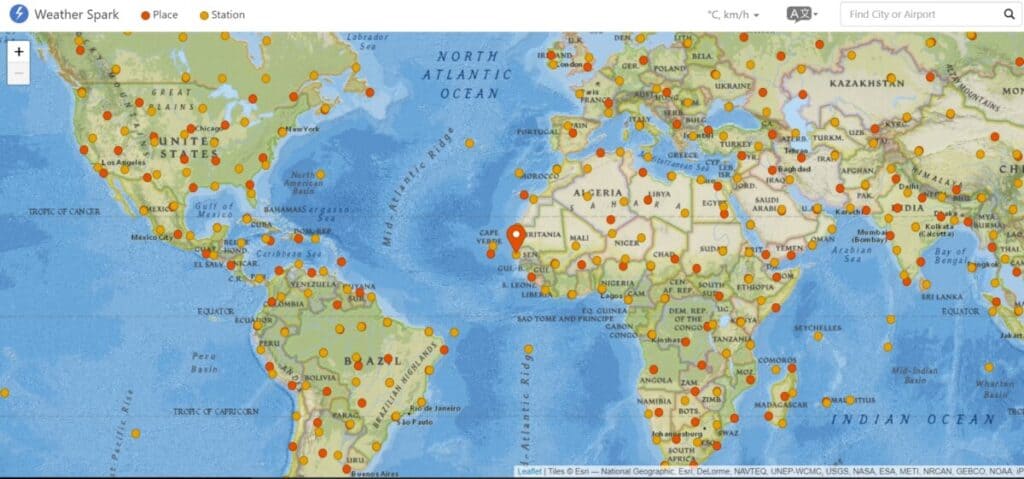
- Choose destinations with a map that shows weather stations throughout the world
- Search for locations by name of the city or airport
3. Travel Weather Map
This is one of the best tools for quickly producing a world map that shows the best places to visit for any week of the year. You can adjust the parameters for Mean Temperature, Low temperature, High temperature, and Days of Rain. The map tool is available in both Fahrenheit (below) and Celsius versions.
Give it a try right here by choosing your preferred temperature range, chance of rain, and relative humidity. With thanks to Champion Traveler. Hold your pointer over one of the blue dots for detailed info on that location.
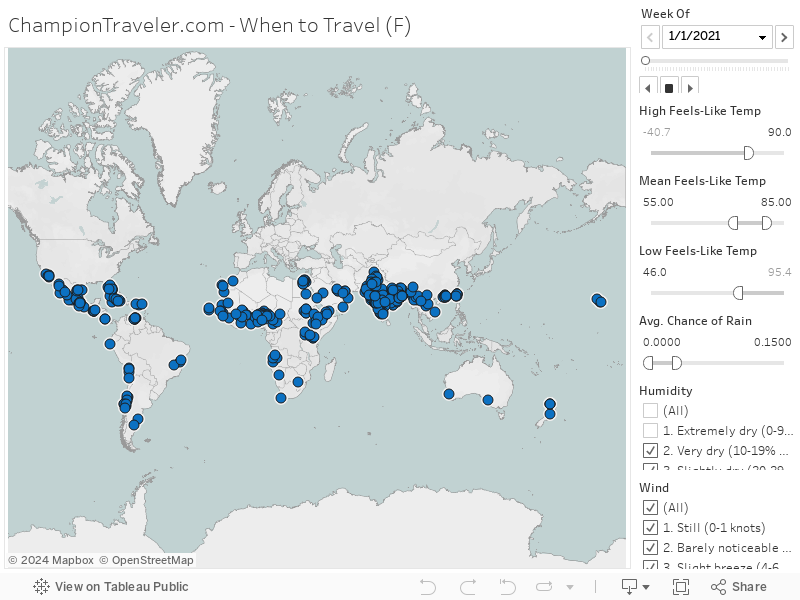
The map was originally created by Ryan Whitaker, a digital nomad who wanted to find destinations with a high likelihood of good weather. He often found himself googling for things like, “best places to visit in January” or “best time to visit Spain.” The results were usually disappointing, with generalizations that were not that useful or skewed recommendations from authors paid to promote a particular location.
Ryan put his data background to good use and produced this mapping tool based on ten years of weather data from NOAA for 10,000 weather stations around the world. The result is this excellent tool that will help you pinpoint the best places to visit at any time of year, anywhere in the world.
4. Women-on-the-Road.com
This website provides a quick overview for the various regions of the world, using charts to help you decide when and where to travel using color coding. This is how the codes are described on the site:

One weakness is that it’s all subjective, without any explanation of how these color codes have been determined. I was particularly mystified with the white squares. The site explains that the white squares “mean “no opinion” – it’s sometimes good, sometimes not, usually an unpredictable mixture.” There’s no data source provided, so it’s hard to say how accurate these charts are.
That said, I still like this website and the way the information is presented on this page to provide colorful and easy to understand tables. You can quickly and easily get a great overview for each region without having to fill-in search parameters. Everything is contained on one page so you can easily scroll up and down to compare various regions of the world.
Here’s the chart for Europe, for example, showing the best time to visit a range of destinations.
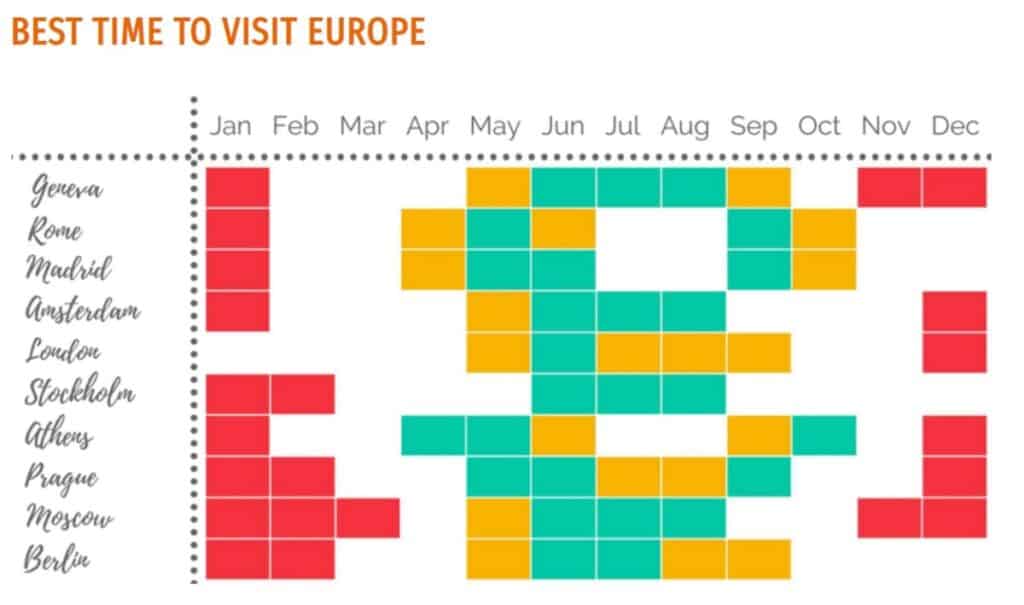
Once again, you can try this site for a quick overview, but I suggest using Weatherspark to get more details such as humidity. I would definitely need more info before booking a ticket based on this website alone.
5. Map of Terrestrial Ecoregions of the World
As naturalists and biologists, we often use this resource for quickly checking and comparing climatic conditions for various locations. The interactive map by Ecoregions2017 ©Resolve depicts 846 ecoregions within fourteen biomes throughout the world.
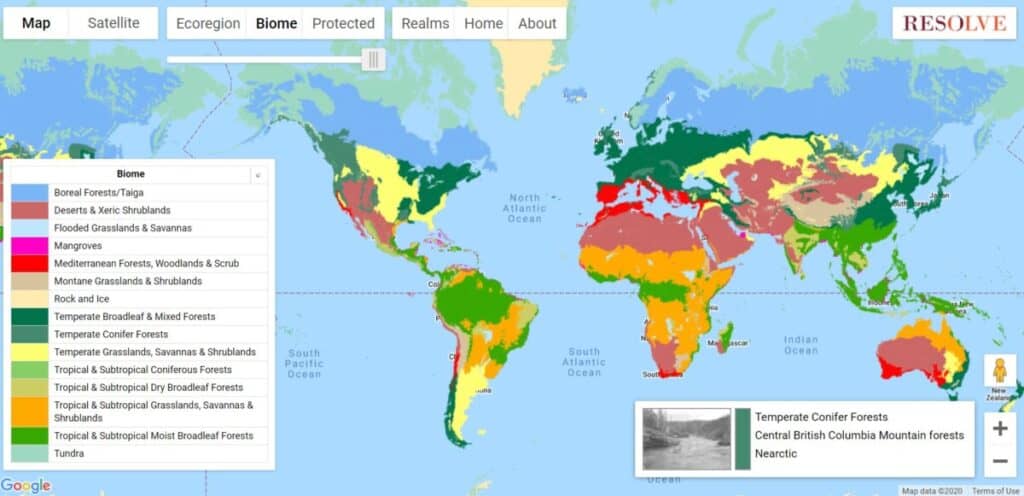
The beauty of this approach is that you can immediately see climatic regions based on longstanding patterns of vegetation and soil. In practical terms, once you know whether your destination is in a desert or in a rainforest, you can begin to plan accordingly!
The map depicts Earth’s terrestrial biodiversity by showing 14 different biomes such as forests, grasslands, or deserts. The biomes are based on 846 terrestrial ecoregions, which are large units of land with distinct assemblages of natural communities.
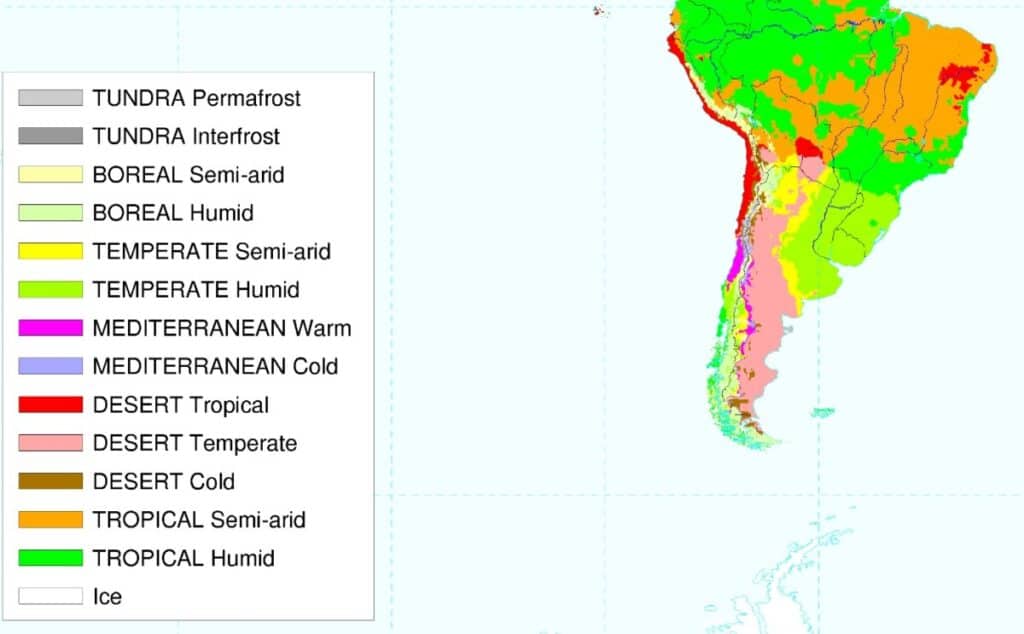
This map of biomes and ecoregions provides a grand overview of climatic conditions, but it doesn’t provide any additional details or information based on month or season. Once again, before booking tickets we suggest digging deeper using the other tools on this page, particularly Climatefinder and Weatherspark.
There you have it – the top sites we use for researching the climate in any location in the world. Wishing you all the best in your search for your next ideal travel destination. Why choose a miserable experience when you can find a destination where you will be comfortable and happy?!
UPDATE – The Best Time to Visit.com is No Longer Available
TheBestTimetoVisit.com WAS a useful website for quickly categorizing the weather you can expect for destinations throughout the world. The URL no longer works – so this information is FYI only!
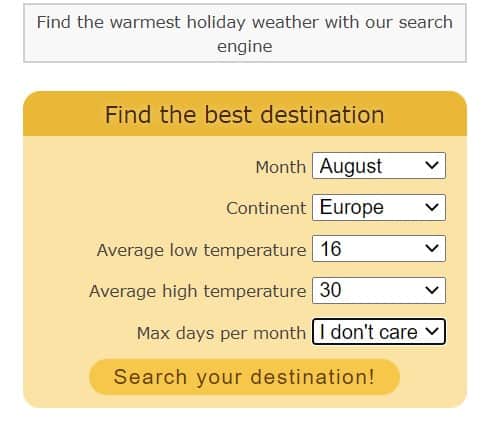
This site provides several ways of checking for the best weather. You can use the search tool – shown below – to search by month, continent, and temperature. You can also get a shortlist of destinations for each month or by season.
Here are some search results based on the search above for August in Europe. One nice feature is the ability to sort each of the columns by clicking on the column header, so you could, for example, easily find the locations with the fewest wet days.
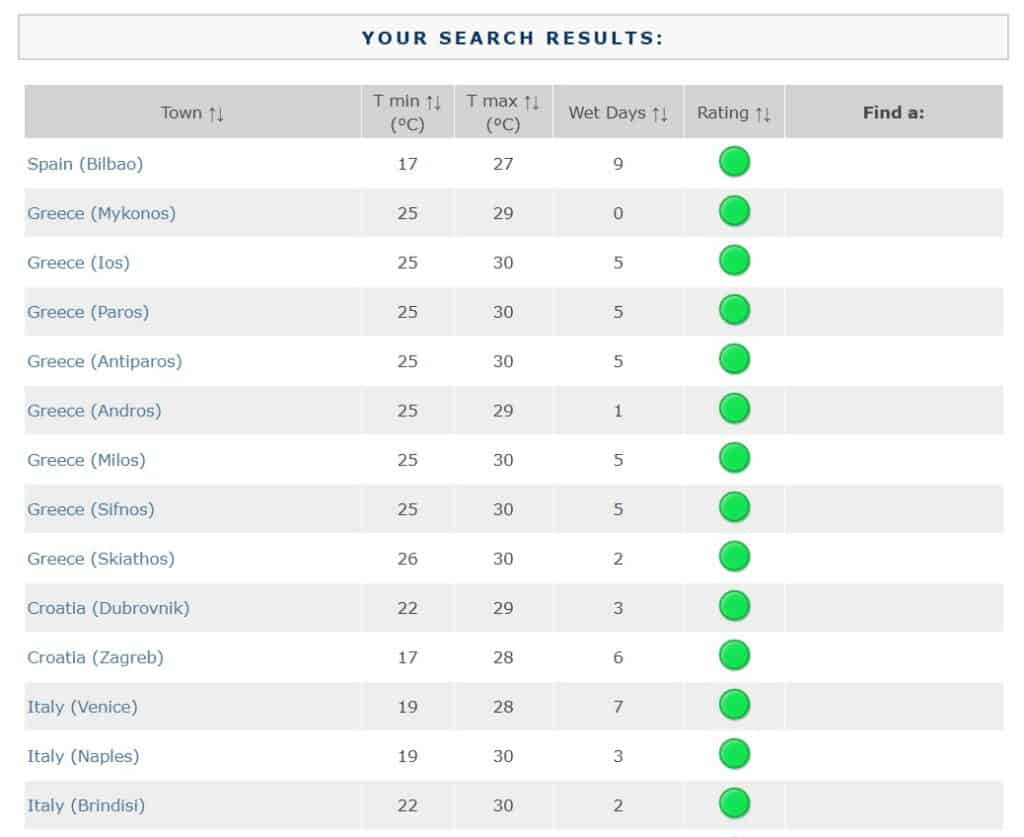
This site uses color coding to give you a quick overview; with green for good times to visit, and yellow or red for less desirable times.
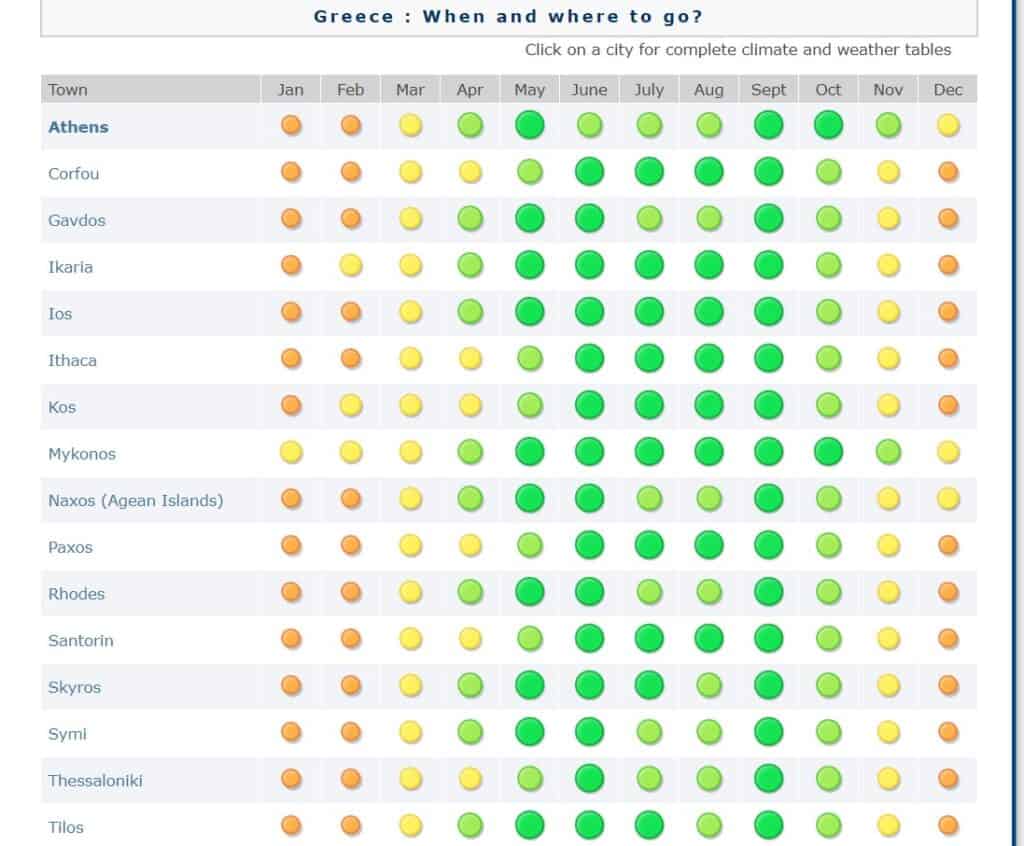
Here’s a screenshot for Greece, showing a color-coded list of cities and towns.
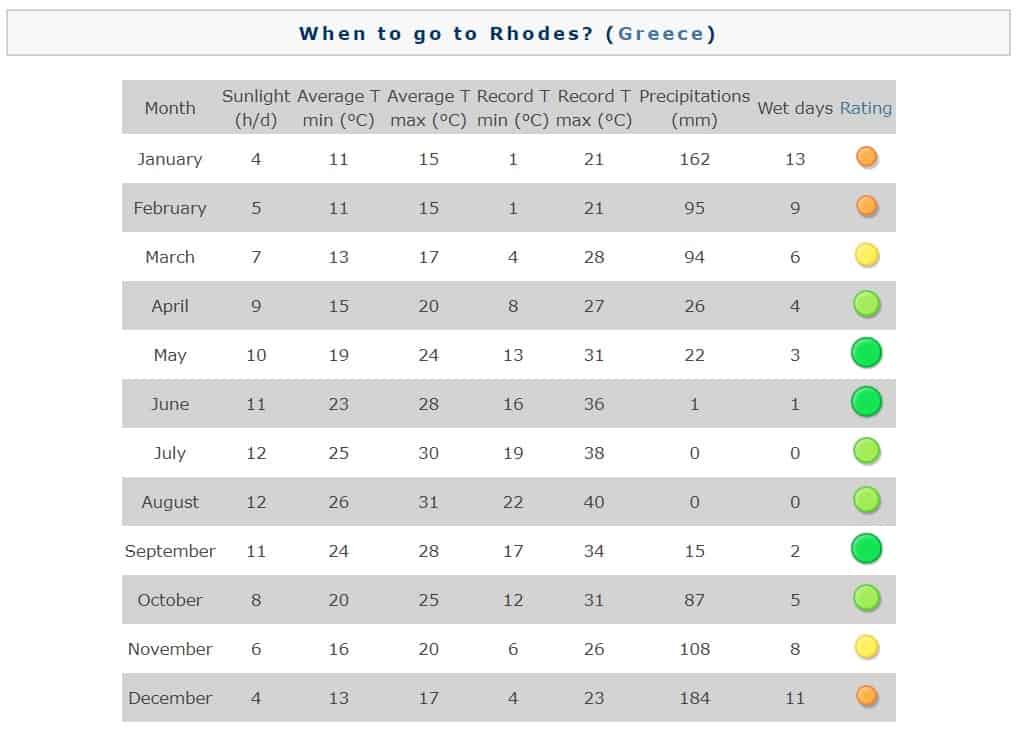
Click on one of the locations or color dots and you are given detailed information such as the table below for Rhodes. There’s a good level of detail, but I don’t find it as useful or as intuitive as the way Weatherspark presents information using colorful charts. One key category that’s missing on this site is the relative level of humidity, and we know how much difference humidity can make! I like to know ahead of time if my visit is going to be comfortable or miserable.
The Best Time to Visit.com provides a few paragraphs of useful suggestions on what to do in each location, including tips, places, hotels, and restaurants.